The Greatest Threat to the Planet: The Right Wing Noise Machine, Part 2

Our problems are more mental than environmental.

A few months ago I posted a piece that was not strictly about climate change, but in fact had everything to do with why we are where we are.  The greatest threat to the planet is not the gases spewing from smokestacks, but the lies and misinformation pouring out of the Right Wing Echo chamber from television, radio, and the right wing press,  which is re-amplified and repeated endlessly on innumerable internet sources.

This piece of video is astounding, maybe because of how routine it’s become.  A group of hard core republican voters, coached by GOP “pollster” Frank Luntz, affirm that they believe, seriously, that Barack Obama is a secret Muslim, who is using his position as President of the United States, to stealthily impose a foreign set of values on America.  Luntz barely misses a beat, other than a quick “Wow..”, and then plows right ahead, seemingly unable to break persona long enough to stop and say, “Are you people out of your freaking minds?”.

The screen splits revealing an impassive Sean Hannity, one of the master misinformers… who also acts as if this is somehow normal.

Continue reading “The Greatest Threat to the Planet: The Right Wing Noise Machine, Part 2”

Graph of the Day: Greenland Ice Sheet Mass Changes


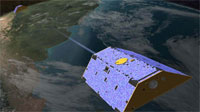
The mass changes of the Greenland Ice Sheet (GIS) are computed from the Gravity Recovery and Climate Experiment (GRACE) inter-satellite range-rate observations for the period April 5, 2003 – July 25, 2009. The mass of the GIS has been computed at 10-day intervals and 200km spatial resolution from a regional high-resolution mascon solution (Luthcke and others, 2008 and 2006). The animation shows the change in mass referenced from April 5, 2003. The spatial variation in surface mass is shown in centimeters equivalent height of water. The time variation of the GIS mass is shown in the x-y plot insert with units of Gigatons.

credit: NASA/Goddard Space Flight Center Scientific Visualization Studio

OK, that’s the geekspeak description. But in plain english, how do we know? What are the Grace Satellites? Heidi Cullen explains below.

Continue reading “Graph of the Day: Greenland Ice Sheet Mass Changes”

Coming to your School?: New Mexico Bill Promotes Anti-Science Education

Bill Maher visits Creation Museum

This week’s Crock Video discussed climate denier Harrison Schmitt, who was recently appointed as  head of Natural Resources in New Mexico. Mr. Schmitt’s allies in the legislature have recently moved to extend the tea party anti-science agenda with a bill aimed at science teaching in public schools.

If there was ever any doubt that an organized anti-science movement exists, and that it includes the climate denial movement, a report from Wired should remove all doubt.

Continue reading “Coming to your School?: New Mexico Bill Promotes Anti-Science Education”

Harrison Schmitt: Environmentalism is Communism

If you care about your children’s future, if you believe other species have a right to exist, if you believe that clean air, clean water, and a livable planet are the minimum that we can pass along to our heirs, then you are now, and have always been,  a communist.

That’s the message from New Mexico’s new chairman of Natural Resources, former Apollo Astronaut Harrison “Jack” Schmitt.

Another famous Jack

An Op-Ed page war over Schmitt’s crackpot science broke out in the Sante Fe New Mexican last week, and the climate denial chorus, including the tobacco and petroleum fueled Heartland Institute, where Schmitt is a board member, rushed to defend his extreme views. Schmitt was the topic of this week’s Climate Crock video, for his dishonest use of cherry picked statistics to claim that Arctic Sea ice extent had “returned to 1989 levels”.

Now, scientists from the National Snow and Ice Data center have weighed in. Since NSIDC data was part of the discussion, they felt that clarification was needed.

Continue reading “Harrison Schmitt: Environmentalism is Communism”

Graph of the Day: R and D Spending in the Energy Sector – and Chevron’s Irony Deficiency

If anyone thinks the Oil industry is working to discover the solution to our energy problems, this graph should set them straight.

The American Energy Innovation Council is the source of the Graph, and has posted a polished video about the problem.

Continue reading “Graph of the Day: R and D Spending in the Energy Sector – and Chevron’s Irony Deficiency”

“We’re going to have just a big brushpile on our hands..”: The Amazon’s 3 “100 year droughts” in the Last 15 Years

In the last 15 years, the Amazon rain forest has been hit by 3 drought events so severe, they would only be expected every 100 years under “normal” conditions.


Continue reading ““We’re going to have just a big brushpile on our hands..”: The Amazon’s 3 “100 year droughts” in the Last 15 Years”

How to Pick a Cherry

Harrison “Jack” Schmitt is a former Apollo astronaut, a far right wingnut, and a Tea Party darling. This makes him a perfect tool for the climate denial industry.

Skeptical Science explains:

In 2009, former astronaut Harrison “Jack” Schmitt submitted a white paper to NASA, Observations Necessary for Useful Global Climate Models. In this paper, Schmitt crams in an impressive number of skeptic arguments – including the argument that we’re currently experiencing cooling:

“How long this cooling trend will persist remains to be seen; however, Greenland glaciers have been advancing since 2006, Artic [sic] sea ice has returned to 1989 levels of coverage, and snowy, cold winters and cool summers have dominated northern North America and Europe”

Continue reading “How to Pick a Cherry”

Graph of the Day: 2010 Wettest Year since 1900

Click for Larger Image

This probably won’t be news in many parts of the world.

From NOAA’s  State of the Climate 2010:

Global precipitation in 2010 was well above the 1961–1990 average, ranking as the wettest on record since 1900. Precipitation throughout the year was variable in many areas. Regionally, drier than average conditions were widespread across much of French Polynesia, the Solomon Islands, Hawaiian Islands, northwestern Canada, extreme northwest and northeast Brazil, and southern Peru. The wettest regions induded most of Central America, much of India, southwestern China, east Asia, Borneo, and parts of Australia.