Sky News report that traces this winter’s Jet Stream set-up from Indonesia, across the pacific to the warmer-than-normal Alaska, drought ridden California, frigid US East, and across the Atlantic to catastrophic storms in the UK. This report is a month old, but still holds up as the pattern described continues.
I made the video above, “What We Knew in 82”, after discovering video of a talk given at Sandia Labs in 1982, by Dr. Mike MacCracken, then a senior researcher at Livermore Lab, and involved in DOE research on climate. The point of the piece was how much was known that long ago about the expected changes in climate due to man-caused greenhouse forcing.
Most people probably don’t know that the physics behind global warming was nailed in the 1950s by military research undertaken to produce the first generation of heat-seeking missiles – described below in a clip from Richard Alley’s “Earth: An Operator’s Manual” –
Now, Dana Nuccitelli describes a paper in a major journal from 1972 that contains remarkable predictions made with the still-very-young science.
John Stanley (J.S.) Sawyer was a British meteorologist born in 1916. He was elected a Fellow of the Royal Society in 1962, and was also a Fellow of the Meteorological Society and the organization’s president from 1963 to 1965.
A paper authored by Sawyer and published in the journal Nature in 1972 reveals how much climate scientists knew about the fundamental workings of the global climate over 40 years ago. For example, Sawyer predicted how much average global surface temperatures would warm by the year 2000.
“The increase of 25% CO2 expected by the end of the century therefore corresponds to an increase of 0.6°C in the world temperature – an amount somewhat greater than the climatic variation of recent centuries.”
Remarkably, between the years 1850 and 2000, atmospheric carbon dioxide levels did increase by very close to 25 percent, and global average surface temperatures also increased by just about 0.6°C during that time.
How much CO2 is contained in the world’s stock of bottled fizzy drinks? How much soda would be needed to bring atmospheric CO2 back to preindustrial levels?
Brandon Seah
For most of the history of civilization, there were about 270 parts per million of carbon dioxide in the atmosphere. In the last hundred years, industrial activity has pushed that number up to 400 parts per million.
One “part per million” of CO2 weighs about 7.8 billion tons. A can of soda contains in the neighborhood of 2.2 grams of CO2, so you would need about 450 quadrillion cans of soda. That’s enough to cover the Earth’s land with ten layers of cans.
–
There’s clearly not enough room to do this. Even if we stacked the cans up to the edge of space,[1] they’d still take up an area the size of Rhode Island.[2]
We’d need to add even more cans to keep up with ongoing emissions. We’re currently increasing the atmosphere’s CO2concentration by an average of 2 parts per million each year:
At that rate, we’d need to add one can of soda per person every 30 seconds, which is about 10,000 times the current consumption rate.[3] That would add a new layer of cans to the ground every 20 years or so.
Australia is embarking on a radical transformation of its electricity system that will see solar PV transition from being “disruptive” technology to the “incumbent” technology, displacing coal and sparking a radical change in the way that electricity is provided.
This is the assessment from Clean Energy Council CEO David Green (pictured), who in a presentation last week said generation will move from its traditional place at the point of supply to at or near the point of use; the primary role of the grid will be converted to that of a back-up “battery”; and consumers will play a key role in a more competitive market.
Green told a Davos Connection conference on infrastructure last week that the core logic behind having large scale generation plants close to their fuel source (coal or hydro) was being challenged by shifts in the basic cost parameters of many sources of energy allow generation (mostly solar) to be built closer to where it is used.
It was clear, he said, that solar PV has been taken up more rapidly in lower-income suburbs than higher income – because of the attraction for lower-income households to get a lower, fixed rate of electricity.
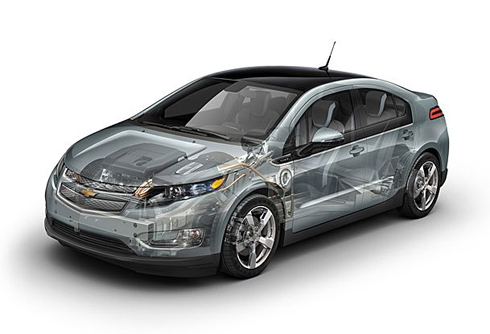
Once a year, J .D. Power puts out a “Dependability Study” of the most reliable 3-year-old vehicles.
And while the overall reliability of these used cars was down for the first time in 16 years – the Chevrolet Volt topped the list for compact cars.
Although the Chevrolet brand placed in the middle of the pack for reliability (13thoverall), GM was still pleased with the Volt’s performance inside the group, along with the Camaro which took home the honor for most dependable “Midside Sporty Car”
“The Volt has redefined how Chevrolet’s electrification technology is helping our customers save fuel and reduce emissions without compromising style, comfort and performance,” said Paul Edwards, U.S. vice president, Chevrolet Marketing.
Reviewers like the 2014 Chevrolet Volt plug-in hybrid’s useful electric-only driving range and composed driving dynamics. Because it has the best combination of positive reviews, price and long-term ownership costs in its class, we named the 2014 Chevrolet Volt the Best Upscale Midsize Car for the Money.
They came, they fished, then snap! They posed. Right in front of their Big Catch — and thereby hangs a tale.
For generations, tour boats have been collecting fishing enthusiasts in Key West, Fla.: taking them for a day of deep sea casting; providing them rods, bait, companionship; and then, when the day ends, there’s a little wharf-side ceremony. Everyone is invited to take his biggest fish and hook it onto the “Hanging Board”; a judge compares catches, chooses a champion, and then the family that caught the biggest fish poses for a photograph. The one up above comes from 1958. Notice that the fish on the far left is bigger than the guy who, I assume, caught it; and their little girl is smaller than most of the “biggies” on the board. Those aren’t little people. Those are big fish.
Here’s another one from the year before — 1957. Again, the fish loom larger than the people. Check out the guy in the back, standing on the extreme right, next to an even bigger giant.
Charter companies have been taking these photos for at least 50 years now. In some cases, they’ve operated from the same dock, fished in the same waters and returned to the same Hanging Board for all that time — which is why, when a grad student working on her doctoral thesis found a thick stack of these photos in Key West’s Monroe County Library, she got very excited. Loren McClenachan figured she could use this parade of biggies to compare fish over time.
For example, here’s a photo taken a decade after the previous shots — during the 1965-1979 period:
Above, my interview from last summer with Dr. Alun Hubbard in Kangerlussuaq. Hubbard described how a GPS device deep in the ice sheet’s interior was beginning to show significant movement.
Newly published evidence continues the story.
Abstract: .. Here, we show that the northeast Greenland ice stream, which extends more than 600 km into the interior of the ice sheet, is now undergoing sustained dynamic thinning, linked to regional warming, after more than a quarter of a century of stability. This sector of the Greenland ice sheet is of particular interest, because the drainage basin area covers 16% of the ice sheet (twice that of Jakobshavn Isbræ) and numerical model predictions suggest no significant mass loss for this sector, leading to an under-estimation of future global sea-level rise. The geometry of the bedrock and monotonic trend in glacier speed-up and mass loss suggests that dynamic drawdown of ice in this region will continue in the near future.
Stability in the rapidly changing Arctic is a rarity. Yet for years researchers believed the glaciers in the frigid northeast section of Greenland, which connect to the interior of the country’s massive ice sheet, were resilient to the effects of climate change that have affected so much of the Arctic.
But new data published Sunday in Nature Climate Change reveals that over the past decade, the region has started rapidly losing ice due to a rise in air and ocean temperatures caused in part by climate change. The increased melt raises grave concerns that sea level rise could accelerate even faster than projected, threatening even more coastal communities worldwide.
“North Greenland is very cold and dry, and believed to be a very stable area,” said Shfaqat Khan, a senior researcher at the Technical University of Denmark who led the new study. “It is surprisingly to see ice loss in one of the coldest regions on the planet.”
The stability of the region is particularly important because it has much deeper ties to the interior ice sheet than other glaciers on the island. If the entire ice sheet were to melt which would take thousands of years in most climate change scenarios sea levels would rise up to 23 feet, catastrophically altering coastlines around the world.
Sea levels have risen 8 inches globally since the start of the 1900s, and current projections show that figure could rise another 3 feet by the end of this century.
“These new measurements show that the sleeping giant is awakening and suggest given likely continued Arctic warming that it’s not going back to bed,” Box said in an email.
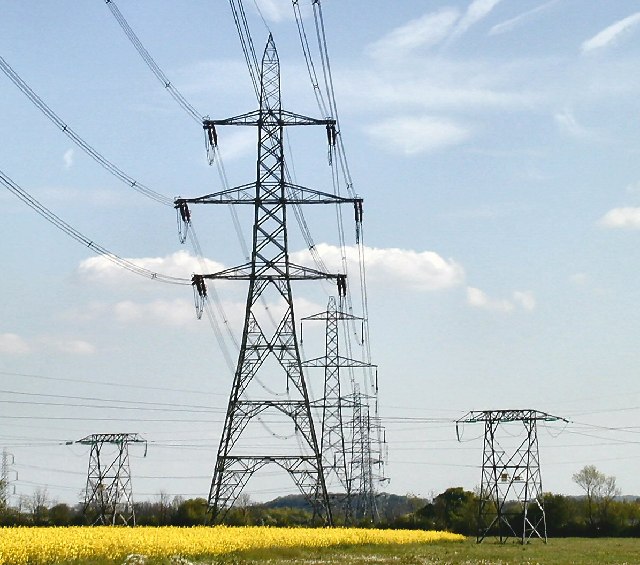
When eagles or other large raptors sit on transformers and the cross-arms of utility poles, their wings can touch adjacent wires or conductors, completing a circuit and causing electrocution. Raccoons, possums, squirrels and other animals can also be electrocuted, as can smaller birds who sit on wires or poles.
Eagles and migratory birds are protected by federal law, and utilities can be prosecuted and fined for causing deaths. Enforcement of the law that protects eagles is being stepped up against wind power operators.
U.S. Fish and Wildlife Service (FWS) spokesperson Laury Parramore said she believes a 2009 case was the last prosecution of a utility under bird protection laws.
There, the utility PacifiCorp pleaded guilty in federal court to violating the Migratory Bird Protection Treaty related to the deaths of 232 eagles on its electric infrastructure in two years in Wyoming, deaths the FWS said could have been prevented with readily available measures. The utility was ordered to pay $1.41 million in fines and restitution and to spend $9.1 million making its system safer for birds.
“The Service’s preferred approach is to work with industry on voluntary compliance,” said Parramore. “Prosecutions occur when companies refuse to cooperate and comply with laws protecting eagles.”
‘Avian safe’
The FWS says that the first documented eagle electrocution from a power line happened in 1922. The service has for several decades been pushing companies to prevent electrocutions. In 1989 the FWS formalized the Avian Power Line Interaction Committee (APLIC), a partnership with the National Audubon Society and investor-owned utilities and universities, that drafts and publishes best practices for protecting birds from power infrastructure.
An academic paper endorsed by the FWS said that collisions with power lines and transmission towers kill hundreds of thousands to 175 million birds annually, while tens to hundreds of thousands of birds are electrocuted annually. The paper noted there is not comprehensive monitoring of the issue, so mortality estimates are rough.