
 Tamino in Open Mind:
Despite recent rains, California is still in the midst of crippling drought. In a recent opinion piece by Martin Hoerling the case is made that essentially, man-made climate change has nothing at all to do with the present California drought.
Thus, the scientific evidence does not support an argument that human-induced climate change has played any appreciable role in the current California drought.
I disagree.
Martin Hoerling is a smart guy, and I wouldn’t call him a “denier.” But we all know how easy it is for smart people to be stupid. It’s even possible for those who aren’t deniers, to deny. I think that’s exactly what Martin Hoerling has done.
There’s a lot of huffing and puffing in the article, but his argument basically boils down to this:
We can also say with high confidence that no appreciable trend toward either wetter or drier conditions has been observed for statewide average precipitation since 1895.
The ironic part is that Hoerling makes this the centerpiece of his argument in spite of emphasizing that drought is not just about precipitation.
It’s true that there’s no significant trend in California precipitation since 1895. Here’s precipitation anomaly, which reduces the counfounding influence of the annual cycle (it tends to be wetter during winter, especially January):
The estimate trend from linear regression (shown by the thick blue line) is decreasing, but not statistically significant even if you don’t correct for autocorrelation. If you do correct for autocorrelation, it’s definitely not statistically significant.
But as Hoerling himself states, drought isn’t just about precipitation. If we look at an actual measure of drought — the Palmer Drought Severity Index, or PDSI — then there is a decreasing trend (which means, toward more and/or more extreme drought) which is statistically significant, even after correcting for autocorrelation:
The blue line shows the trend estimated by linear regression, the red line shows a lowess smooth. Yes, there’s a trend toward more drought in California. Yes, it’s statistically significant. Martin Hoerling’s claim that there’s “no appreciable trend … for statewide average precipitation” is true, but misleading. What’s worse, hereally ought to know better.
A similar, but weaker, trend shows up in a common measure of short-term drought, the Palmer Z-index:
Note that this last January (the last month for which data are presently available from the National Climate Data Center) is the lowest on record. We can see the trend more clearly if we just plot the smoothed version, together with the estimated linear trend.
After correcting for autocorrelation, the linear trend is not quite significant at the 95% confidence level. It’s “only” significant at the 94.8% confidence level. Statistically speaking, it’s one of those things that make you go “Hmmm…”
But instead of making Martin Hoerling go “Hmmm…” it seems to have made him go wrong. Or perhaps he hasn’t even looked at the PDSI or Z-index — in which case, what the hell is he doing pontificating about the California drought? He tries his best to assert that it’s definitely not the case that “human-induced climate change has played any appreciable role in the current California drought.” It sure reads to me as though he isn’t saying “Hold on, let’s not be so sure,” like a genuine skeptic — instead he’s asserting that he knows it ain’t so — like a denier.
What’s worse, for Californians, is that the snowpack in the Sierra Nevada mountains is so low that one can expect drought conditions to persist, possibly even worsen, throughout the year. An extreme example (yes it’s cherry-picked, in order to make a point) is the data from the SNOTEL site at Independence Creek:
Each line represents the snow-water-equivalent (SWE) in the snowpack throughout a single year. The thick red line is the SWE for this year. Notice anything striking about it? Here’s a close-up of the first three months, to make this year’s snowpack easier to compare to previous years’:
Given the current state of affairs, the outlook for California’s water supply this year isn’t just “not good,” it’s grim.
Maybe Martin Hoerling thinks he’s being the “honest broker” and arguing for some sort of “restraint” in assigning a role of man-made global warming. If he thinks that, he’s fooling himself, because he really doesn’t give the impression “hold on, let’s not be so sure,” he gives me the impression “there’s no connection at all and I’m sure of it.” And in that, he’s just plain wrong.
In my opinion, he’s also being irresponsible. Tremendously irresponsible. Man-made climate change is a huge threat to California, and this year’s drought is a perfect example why. It should be an alarm to “Wake up and smell the coffee,” but Martin Hoerling is saying “There is no coffee.”
One of the saddest aspects of this is that the present situation was predicted. The prediction was stunningly accurate — but I do realize that it’s possible to make a prediction which is stunningly accurate because you got lucky. Nonetheless, a stunningly accurate prediction is powerful evidence, and if correct, it means thatman-made global warming was actually the cause of the present California drought, because man-made global warming certainly did cause the disappearance of Arctic sea ice. According to the scientists who made the prediction, prospects for the future are not good. I’d go so far as to say “grim.”


“After correcting for autocorrelation, the linear trend is not quite significant at the 95% confidence level. It’s “only” significant at the 94.8% confidence level. Statistically speaking, it’s one of those things that make you go “Hmmm…””
Is a 95% confidence level even appropriate for climate studies which have such a high level of noise?
Also, the idea that there either “is” or “is not” any significance just because any particular statistic falls outside of an arbitrary definer is ridiculous. The result talked about above is STILL significant at a 94.8% confidence level, which is STILL almost identically just as significant as a 95% level. 94.8% is a very significant result.
“…man-made global warming was actually the cause of the present California drought…”
We know that AGW has put a lot more moisture into the atmosphere, a huge amount of increased heat in the air and land and oceans. It is differentially heating the poles and deep oceans at the moment – the point being that it has effects which are not minimized by a perfectly uniform distribution.
Is it even a reasonable assertion to say that these facts will have zero effect on weather? Because that is EXACTLY what the climate denier’s argument assumes – that it is our onus to prove that AGW absolutely “caused” the drought.
I would argue that the onus should be on the other side’s shoulders. Prove to us how all that extra moisture and energy in the system could not possibly effect weather in California. ( And Texas, and Oklahoma, and the Arctic, and Greenland, etc).
The Arctic ice cap is about to disappear because of AGW, but AGW could not be behind drought in California? Seriously?
I’m not sure where I saw this term – maybe it was here on CDCotW – ‘systemic causality’. The climate has changed, and therefore it has to have “caused” it – although, it is kind of the other way around.
We get strange or more extreme weather, and higher temperatures more often, and that is data which shows that the climate is changing.
Texas populist Jim Hightower makes the case that climate change deniers are messing with….. beer. And it’s personal.
http://www.jimhightower.com/node/8271#.Ux398s6PPcw
Snip: ” Okay, climate-change deniers – you’ve gone too far. You’ve gone from just being annoying know-nothings to now posing a serious threat to an essential good that embodies humankind’s finest collaboration with nature: Beer.
“It’s one thing for the science denial cult to stand in the way of doing something about melting ice caps in the Arctic, but it’s another thing altogether for them to mess with beer. This makes it personal.” [Continues at website….]
Dream Flows is a boater’s service website hosted by a buddy of mine. He’s put together the most sophisticated U.S. river flow report I’m aware of. Here’s what’s running (from a gush to a trickle) in California:
http://www.dreamflows.com/flows.php?page=real&zone=canv&form=norm&mark=All
As we can see, NW California is getting plenty of rain at the moment. This would be the Smith, Cal-Salmon, Klamath, Eel, Trinity, Scott, et al.
But the important Sierra rivers are still way boney for this time of year.
Drought is not precipitation, and this fellow is not an expert on precipitation. As Gleick points out, the data trend indicates neither increase nor decrease statistically, according to some confidence level. Hoerling makes the mistake of concluding that lack of statistical rainfall evidence ( trend below noise) means no evidence and rainfall equals drought. Not very impressive. Certainly, there is some debate among drought experts. Their conclusions are veering towards an increase in drought as they deliberate. A hasty non peer reviewed conclusion in an opinion piece is hardly definitive or meaningful. We don’t need opinions. We need good research.
If you google ‘Jeff Masters California’s Sierra Snowpack Only 12% of Average’ there’s a discussion in there about drought in the Western North American continent overall that includes this chilling graphic of precipitation trends from 1900-2100:
http://icons.wxug.com/hurricane/2013/drought-western-us-1900-2100.png
It’s normalized to the precipitation which occurred in the drought of 2000-2004 (the worst Western drought in 800 years). It looks pretty cut and dried to me.
I seem to recall 20 years ago learning that while they didn’t expect CA’s precipitation to drop off the deep end with AGW, they expected more of it to fall as rain, and as flood events = drought anyway.
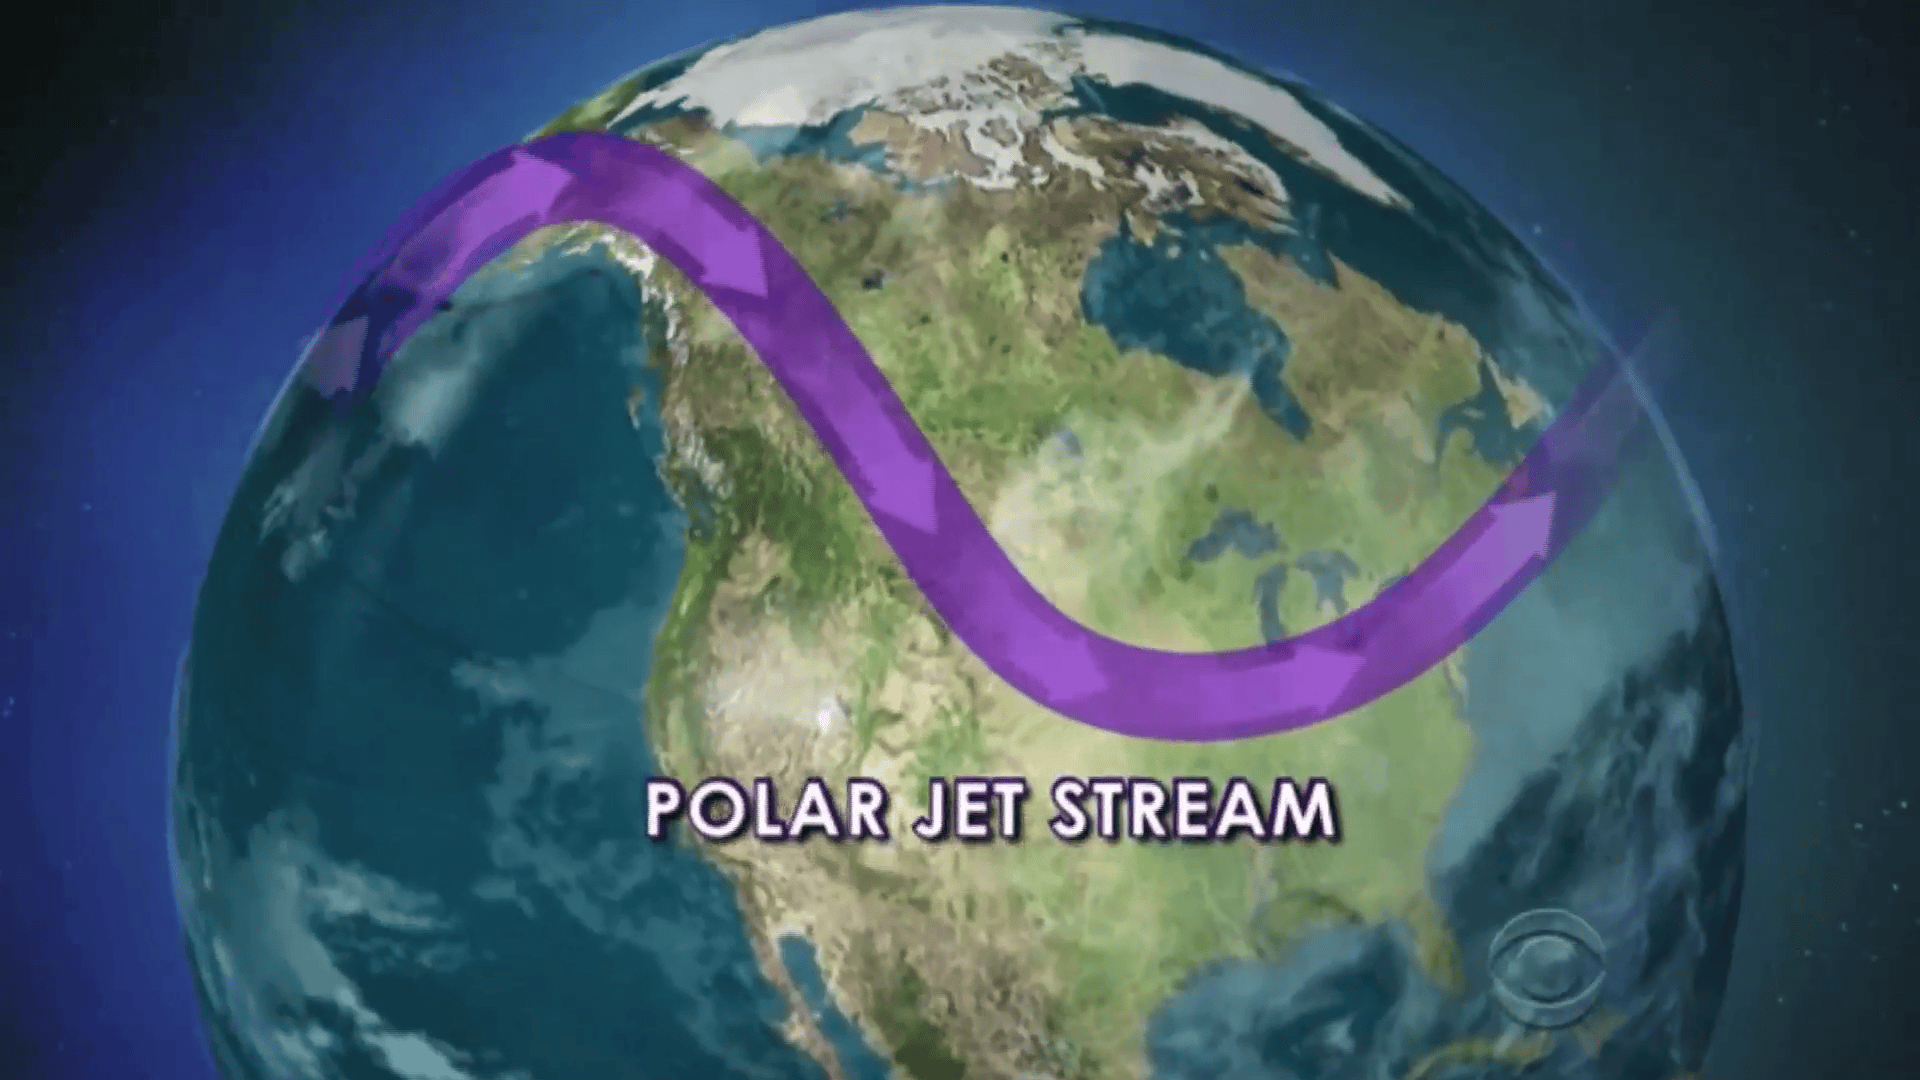
Tamino: “…the present situation was predicted.” That’s a fascinating link to a 2004 study that predicted the ridge of high pressure currently positioned off CA as related to Arctic ice loss. A bit scary that Climatologists are seeing some of their ‘what if’ model results verified in as few as 10 years!
Here’s a historical study of western drought. Basically, last time we saw a ~0.5 to 1C increase in temps, during the Medieval Warm Period, the western US suffered several mega droughts:
Long-Term Aridity Changes in the
Western United States
Edward R. Cook,
1
*
Connie A. Woodhouse,
2
C. Mark Eakin,
2
David M. Meko,
3
David W. Stahle
4
Abstract:
The western United States is experiencing a severe multiyear drought that is
unprecedented in some hydroclimatic records. Using gridded drought
reconstructions that cover most of the western United States over the past
1200 years, we show that this drought pales in comparison to an earlier
period of elevated aridity and epic drought in AD 900 to 1300, an interval
broadly consistent with the Medieval Warm Period. If elevated aridity in the
western United States is a natural response to climate warming, then any
trend toward warmer temperatures in the future could lead to a serious long-
term increase in aridity over western North America.
First part of the body:
More than 50% of the coterminous United States experienced moderate to severe drought conditions in 2002, with record or near-record precipitation deficits throughout the western United States (1). Large portions of the Canadian Prairie provinces also suffered from severe drought, as well as ex-
tensive areas of Mexico, particularly in the northern and western parts of the country. In many of these areas, the 2002 drought was actually part of an ongoing drought that started in late 1999 or before, with widespread
drought conditions already persisting for ~3 years. Drought abated in many areas by late 2002 to early 2003, but severe drought conditions have continued to affect the interior western United States throughout the 2004 summer (2).
This drought highlights both the extreme vulnerability of the semi-arid western United States to precipitation deficits and the need to better understand long-term drought variability and its causes in North America. To this end, we have used centuries-long, annually resolved tree-ring records to recon-
struct annual changes in both drought and wetness over large portions of North America. The reconstructed drought metric is the summer-season Palmer Drought Severity Index (PDSI) (3), a widely used measure of relative drought and wetness over the United States (4) and other global land areas (5,6).
New PDSI reconstructions have been produced on a 286-point 2.5- by 2.5- regular grid(Fig. 1) (7). This grid covers most of North America and is a substantial expansion of an earlier 155-point 2- by 3- drought reconstruc-
tion grid that covered only the coterminous United States (8). In addition, our drought reconstructions are 600 to 1200 years long over much of the U.S. portion of the North American grid (particularly in the western United States), a substantial increase over the ~300 years available from the previously
published reconstructions, which all began in 1700. Finally, the variance restoration we apply to the grid point reconstructions (7) allows for updates of those records to AD 2003 with instrumental PDSI data. Together, these attributes enable us to compare the current western U.S. drought to those that
are reconstructed to have occurred as far back as AD 800, a time period that includes the so-called Medieval Warm Period (MWP). The region of interest here is contained within an irregular black polygon on the North American grid (Fig. 1), an area that we henceforth refer to simply as the West. Each of the 103 grid points in the West has a summer PDSI reconstruction that covers the common interval AD 1380 to 1978, with a minimum of 68 grid points having reconstructions that extend back to AD 800.
[Sorry got tired of cut-n-paste-n-format editing; if you want to read the rest, it’s at http://www.sciencemag.org/content/306/5698/1015.full.pdf?sid=ea01001d-f6fa-4fde-a07d-fece0c9833b2 but you have to sign in to get access i think.]
One of my first real exposures to the topic of climate change occurred on a trip through the Southwest in 1966. Visits to Mesa Verde, Canyon de Chelly, Wupatki, Montezuma’s Castle and other Anasazi sites will give you a good understanding of what the Southwest faces with this “unprecedented” drought. A culture that had existed in the area for 1000 years disappeared in the blink of an eye, leaving behind nothing but ruins.
Don’t let Off. Topic. Ray. distract you from the point of this post—–Peter closed with “………prospects for the future are not good. I’d go so far as to say “grim.” I agree.
Why can’t governments (left, right and central) just accept that GHGs have already changed our climate ?, whether the Californian drought was caused, aggravated or is being prolonged by the change is purely academic. How much time is wasted in waiting for academic proof ? What is for sure is that changes are ongoing. solar and atmospheric physicists were traditionally an important source for climate matters.
Recent quotes:
Sun’s energy influences 1,000 years of natural climate variability in North Atlantic
The study, led by Cardiff University scientists, in collaboration with colleagues at the University of Bern, is published today in the journal Nature Geoscience.
Predictions suggest a prolonged period of low sun activity over the next few decades, but any associated natural temperature changes will be much smaller than those created by human carbon dioxide emissions, say researchers.
Solar activity heads for lowest low in four centuries
“But Lockwood says we should not expect a new grand minimum to bring on a new little ice age. Human-induced global warming, he says, is already a more important force in global temperatures than even major solar cycles.”
If atmospheric and solar physicists are agreeing that GHGs from the industrial revolution are more influential than solar patterns isn’t that in itself enough to spur us all into action ?
Why do I care ?, well the industrial and technical revolution has provided me a fairly comfortable life, but more importantly I wish my children and grandchildren an even better life, not misery fighting a broken ecosystem.
I’m sure that WUWT and like could find a contrarian (like Judith Curry) to argue, and waste even more time and cause yet more frustrating inaction.
http://www.newscientist.com/article/dn24512-solar-activity-heads-for-lowest-low-in-four-centuries.html
http://phys.org/news/2014-03-sun-energy-years-natural-climate.html
I’ve just seen that the phys.org “Sun’s energy influences 1,000 years of natural climate variability in North Atlantic” report is surprisingly the lead article in WUWT, I tried to spot the difference – but it looks complete and the ghg part is left in, Has Anthony Watts turned ? some of the vitriolic comments to the report make me wonder if I’m a member of the same species
It’s impressive how many Anthony Watts readers made it to the last paragraph. If he “turns”, those readers will turn on him.
One of the very unfortunate results of AGW is discussed below.
“The Sixth Extinction: An Unnatural History”
by Elizabeth Kolbert
BOOK TV: About the Program
Elizabeth Kolbert argues that we are currently undergoing a sixth mass extinction (five others have occurred over the past 500 million years). She says that it is likely that this one, the result of human action, will be the most devastating. Ms. Kolbert spoke at the Seattle Town Hall.
http://www.booktv.org/Program/15447/quotThe+Sixth+Extinction+An+Unnatural+Historyquot.aspx
And here’s a 10 minute YouTube segment from the same program:
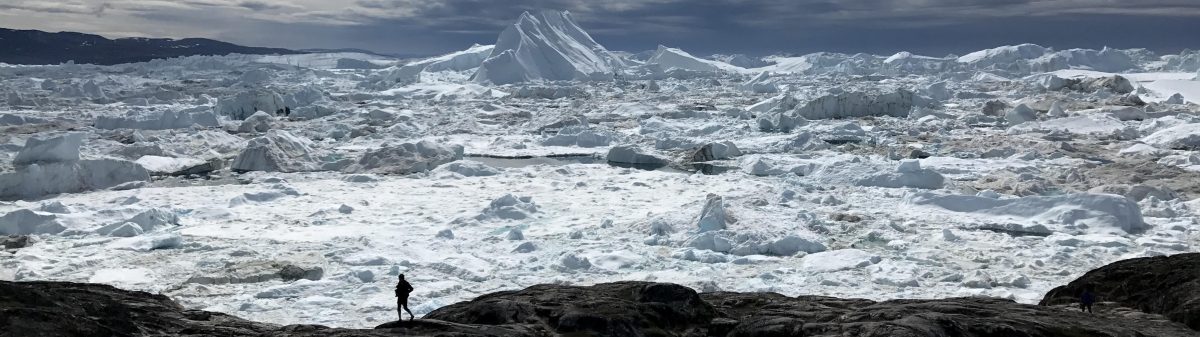
Wow! This is fun even without LSD. The psychedelic beauty of melting ice:
Sleepless in the Senate.
The Democrats do Climate Change:
http://www.c-span.org/video/?318185-1/us-senate-climate-change
http://www.theguardian.com/world/2014/mar/10/us-senate-climate-change-live
Blurb:
Environment
Sleepless in the Senate: Democrats pull all-nighter for climate change – live
Live
28 Democrats have signed on to an all-night speechathon to try to push Congress to take up climate change